Data at Work

Companion site for the book. And more.

  • Twitter

Buy Now at Amazon

Visit publisher's page

Copyright © 2016 Wisevis

  • The Book ▼
    • 00 Introduction
    • 01 The building blocks of data visualization
    • 02 Visual Perception
    • 03 Beyond Visual Perception
    • 04 Data Preparation
    • 05 Data Visualization
    • 06 Data Discovery, Analysis, and Communication
    • 07 How to Choose a Chart
    • 08 A Sense of Order
    • 09 Parts of a Whole: Composition Charts
    • 10 Scattered Data
    • 11 Change Over Time
    • 12 Relationships
    • Chapter 13: Profiling
    • 14 Designing for Effectiveness
    • 15 Color: Beyond Aesthetics
    • 16 Conclusion
  • About Me
  • Contact Me
  • Excel Charts

Chapter 6: Data Discovery, Analysis, and Communication

chapter06
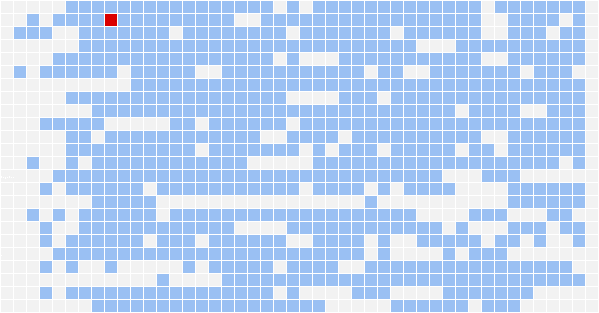
Visualizing data quality

The more knowledgeable you are about the data, the more linear the visualization process tends to be. If you have in your hands a new data table you know nothing about, the sequence will be much less linear, and often you’ll be forced to return to earlier stages to ask new questions, search for new data, or change priorities. Chapter 6 discusses this process and evaluates it against a simple project.

Corrections & Suggestions

None so far.

Files

  • (XLSM) Workbook for Chapter 6.

Additional Resources

  • Shneiderman, Ben. “The Eyes Have It: A Task by Data Type Taxonomy for Information Visualizations.” IEEE Symposium on Visual Languages, 1996.
  • Food availability as a proxy to actual consumption.
  • Gapminder: Dollar Street.

Corrections? Suggestions? Leave a replay below. Cancel reply

Your email address will not be published. Required fields are marked *