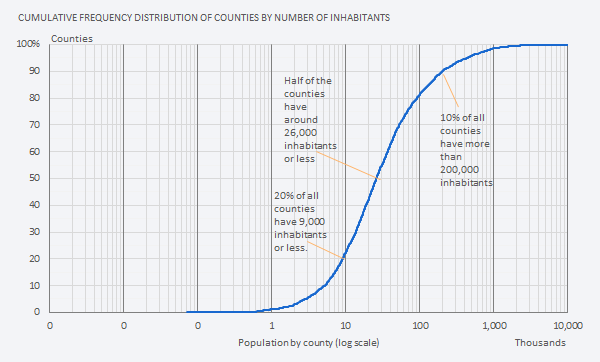
 This chapter explores the intertwined nature of data visualization and statistics. We will not go beyond basic descriptive statistics, but that should be enough to understand the reasons why visualization and statistics need each other. Often people evolve from a purely visual perspective to a more balanced approach because statistics provide a solid framework for improving their visualizations. The inverse is also true: Many statisticians (including Francis Anscombe, William Cleveland, and John Tukey) realize the need of data visualization for better statistical analysis.
Corrections & Suggestions
None so far.
Files
- (XLSM) Workbook for Chapter 10.
Additional Resources
None so far.

Corrections? Suggestions? Leave a replay below.