Jacques Bertin defines his semiology of graphics as a “visual transcription of a data table.” In a perfect world, this table materializes in front of us when we need it, ready to use. In everyday reality, however, things involve more sweat and less magic. People coined the expression “data janitor” for a reason. Excel users are often not aware of how a bad data structure impacts their work. This chapter discusses the basics of ETL (Extract, Transform, Load) and shows how a pivot table can be used as a litmus test for well-structured data.
Corrections & Suggestions
- With (or after) the United Nations 2015 Revision of World Population Prospects, the interface was also updated, so Figure 4.9 no longer reflect the current interface. The link below points to the current page.
Files
- (XLSM) Workbook for Chapter 4.
Additional Resources
- MacDorman, Marian F. and Matthews, T.J. “Behind International Rankings of Infant Mortality: How the United States Compares with Europe.” NCHS Data Brief, No. 23, November 2009.
- CIA, The World Factbook (UK selected)
- (PDF) Wickham, Hadley. “Tidy Data.” Journal of Statistical Software, Vol. 59, No. 10, August 2014.
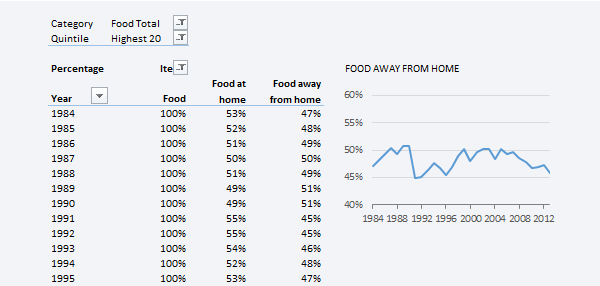
- Bureau of Labor Statistics: Consumer Expenditure Survey.
- United Nations Population Division.
- Tabula: Extract data from PDF files.
- Eagereyes: When Details Hide the Story
- Transposing a Dataset with a PivotTable.
- Excel Charts: 10 tips to improve your Excel dashboard.
- VisualLoop: Adolfo Arranz
Possible typo [P.95 of hardcopy] : “formulas are a thread to data integrity” [*threat ?]
Oops. Thanks Mark, you’re right.